
Write a full paper
A research paper answers one question and shows the reader how you answered it. Most papers follow the same shape, known as IMRaD: Introduction, Methods, Results and Discussion.
The shape of a paper
Section titled “The shape of a paper”| Section | The question it answers |
|---|---|
| Title, abstract, keywords | What is this, in brief? |
| Introduction | What is the problem, and what do you do about it? |
| Related work | What have others done, and what is missing? |
| Methods | What exactly did you do? |
| Results | What did you find? |
| Discussion | What does it mean? |
| Limitations | What does it not show? |
| Conclusion | What should the reader remember? |
| Acknowledgments, declarations | Who helped, who paid, who did what? |
| References | Whose work did you build on? |
Some fields join Related work into the Introduction, or Results and Discussion into one section. Follow what your call and your field expect.
A complete example
Section titled “A complete example”A short full paper with everything a paper usually holds, as the Quorum Press preview shows it. You can download it as a PDF, and you can make it yourself: the text it was made from is below, ready to copy.
It has:
| Part | In the example |
|---|---|
| Title block, abstract and keywords | Typed into their own boxes, above the text |
| Sections and subsections | Introduction to Conclusion, with subsections |
| Bold and italic | One term in bold, one phrase in italic |
| A bullet list and a numbered list | The materials, and the steps of a run |
| Formulas in a sentence | Symbols such as the drying constant, with units |
| Numbered equations | Three, the last with a root and a sum |
| Code | A short script, coloured as Python |
| A figure | A chart, with its caption below and numbered for you |
| A table | Numbers aligned right, its caption above and numbered for you |
| A quote | What a farmer said |
| Citations and references | Five sources, each citation a link to its entry |
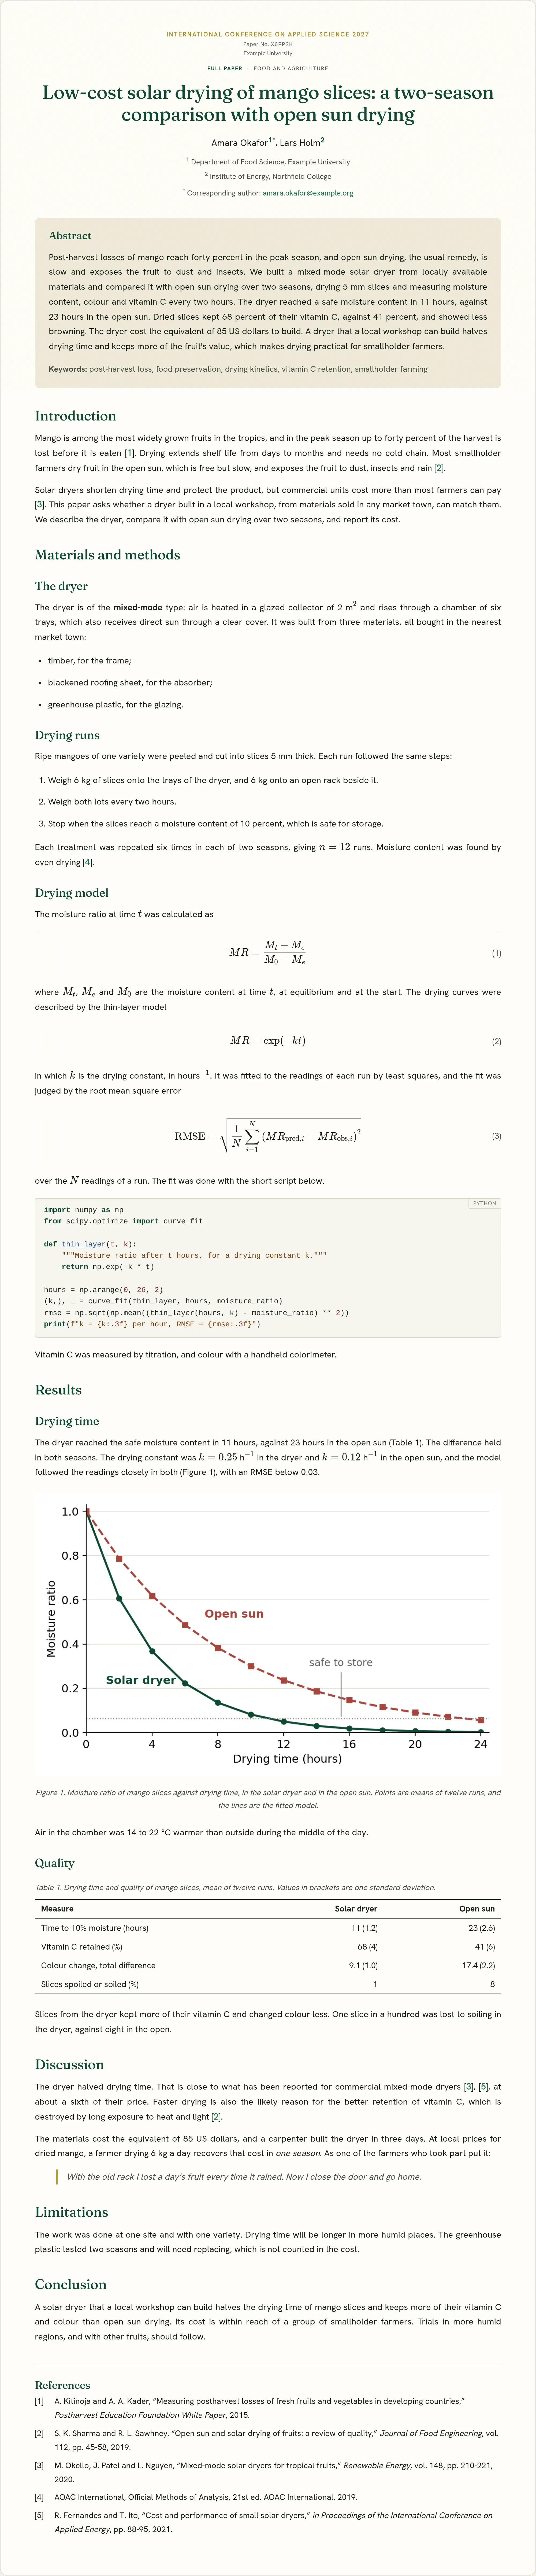
Notice what it does:
- The introduction ends by saying what the paper does.
- The methods give sizes, numbers of runs and how each thing was measured.
- The results point to the table and state the finding in words.
- The discussion compares with other work and gives the cost.
- Limitations are named plainly.
- Every source cited in the text is in the reference list, and the other way round.
- The figure and the table are each named in the text before they appear, and each caption can be understood without reading the text.
- Symbols are explained straight after the equation that uses them.
Make this paper yourself
Section titled “Make this paper yourself”The example was made by pasting the text below into an empty paper. Do the same to see how each part is written, then change it into your own.
-
Start a full paper on any open call. You do not have to send it, and you can discard it afterwards.
-
Press the copy button at the top right of the text below.
-
Click in the empty text of your paper and paste, with
Ctrl+V(Cmd+Von a Mac).The headings, lists, equations, code, figure and table are drawn, and the reference list moves into the References panel.
-
Press Preview. You see the paper as in the picture above, under your own title, authors and abstract.
# Introduction
Mango is among the most widely grown fruits in the tropics, and in the peak season up to forty percent of the harvest is lost before it is eaten [1]. Drying extends shelf life from days to months and needs no cold chain. Most smallholder farmers dry fruit in the open sun, which is free but slow, and exposes the fruit to dust, insects and rain [2].
Solar dryers shorten drying time and protect the product, but commercial units cost more than most farmers can pay [3]. This paper asks whether a dryer built in a local workshop, from materials sold in any market town, can match them. We describe the dryer, compare it with open sun drying over two seasons, and report its cost.
# Materials and methods
## The dryer
The dryer is of the **mixed-mode** type: air is heated in a glazed collector of 2 m$^2$ and rises through a chamber of six trays, which also receives direct sun through a clear cover. It was built from three materials, all bought in the nearest market town:
- timber, for the frame;- blackened roofing sheet, for the absorber;- greenhouse plastic, for the glazing.
## Drying runs
Ripe mangoes of one variety were peeled and cut into slices 5 mm thick. Each run followed the same steps:
1. Weigh 6 kg of slices onto the trays of the dryer, and 6 kg onto an open rack beside it.2. Weigh both lots every two hours.3. Stop when the slices reach a moisture content of 10 percent, which is safe for storage.
Each treatment was repeated six times in each of two seasons, giving $n = 12$ runs. Moisture content was found by oven drying [4].
## Drying model
The moisture ratio at time $t$ was calculated as
$$MR = \frac{M_t - M_e}{M_0 - M_e}$$
where $M_t$, $M_e$ and $M_0$ are the moisture content at time $t$, at equilibrium and at the start. The drying curves were described by the thin-layer model
$$MR = \exp(-k t)$$
in which $k$ is the drying constant, in hours$^{-1}$. It was fitted to the readings of each run by least squares, and the fit was judged by the root mean square error
$$\mathrm{RMSE} = \sqrt{\frac{1}{N} \sum_{i=1}^{N} \left( MR_{\mathrm{pred},i} - MR_{\mathrm{obs},i} \right)^2}$$
over the $N$ readings of a run. The fit was done with the short script below.
```pythonimport numpy as npfrom scipy.optimize import curve_fit
def thin_layer(t, k): """Moisture ratio after t hours, for a drying constant k.""" return np.exp(-k * t)
hours = np.arange(0, 26, 2)(k,), _ = curve_fit(thin_layer, hours, moisture_ratio)rmse = np.sqrt(np.mean((thin_layer(hours, k) - moisture_ratio) ** 2))print(f"k = {k:.3f} per hour, RMSE = {rmse:.3f}")```
Vitamin C was measured by titration, and colour with a handheld colorimeter.
# Results
## Drying time
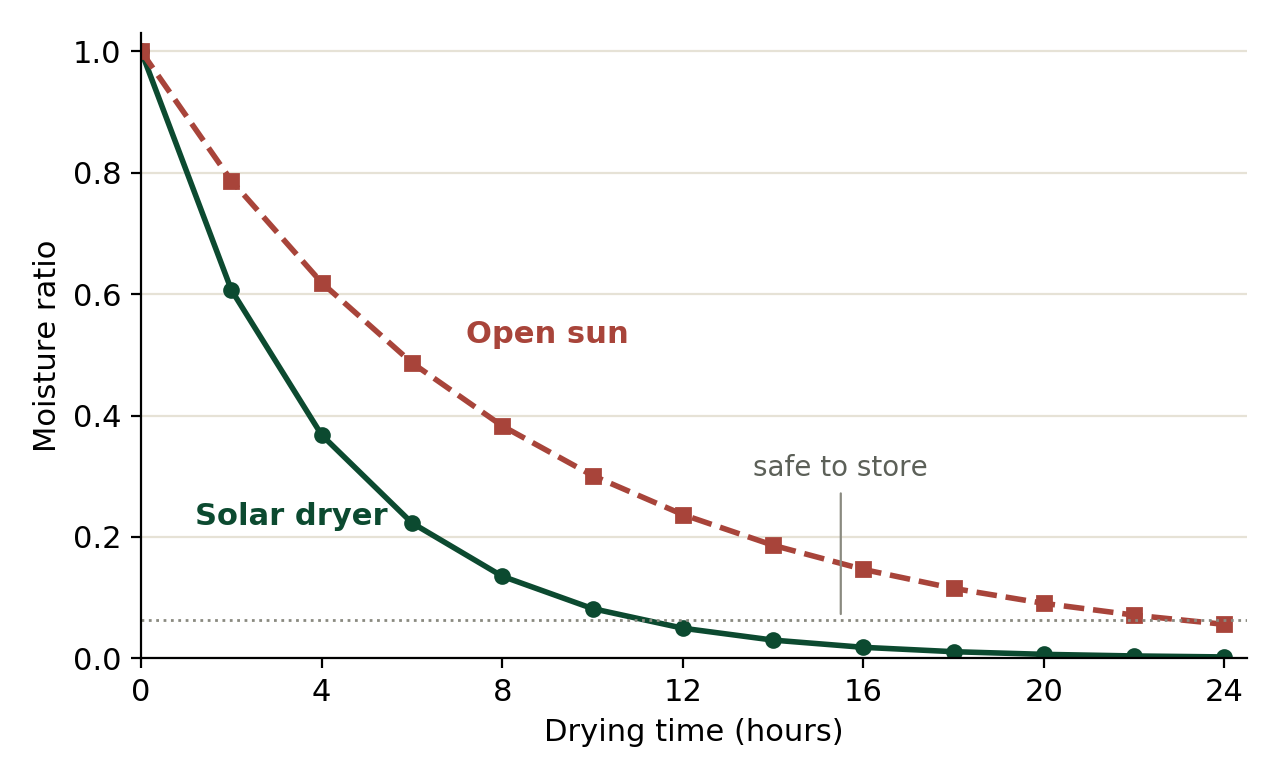
The dryer reached the safe moisture content in 11 hours, against 23 hours in the open sun (Table 1). The difference held in both seasons. The drying constant was $k = 0.25$ h$^{-1}$ in the dryer and $k = 0.12$ h$^{-1}$ in the open sun, and the model followed the readings closely in both (Figure 1), with an RMSE below 0.03.
Air in the chamber was 14 to 22 °C warmer than outside during the middle of the day.
## Quality
| Measure | Solar dryer | Open sun ||:--------|------------:|---------:|| Time to 10% moisture (hours) | 11 (1.2) | 23 (2.6) || Vitamin C retained (%) | 68 (4) | 41 (6) || Colour change, total difference | 9.1 (1.0) | 17.4 (2.2) || Slices spoiled or soiled (%) | 1 | 8 |
Table: Drying time and quality of mango slices, mean of twelve runs. Values in brackets are one standard deviation.
Slices from the dryer kept more of their vitamin C and changed colour less. One slice in a hundred was lost to soiling in the dryer, against eight in the open.
# Discussion
The dryer halved drying time. That is close to what has been reported for commercial mixed-mode dryers [3], [5], at about a sixth of their price. Faster drying is also the likely reason for the better retention of vitamin C, which is destroyed by long exposure to heat and light [2].
The materials cost the equivalent of 85 US dollars, and a carpenter built the dryer in three days. At local prices for dried mango, a farmer drying 6 kg a day recovers that cost in *one season*. As one of the farmers who took part put it:
> With the old rack I lost a day's fruit every time it rained. Now I close the door and go home.
# Limitations
The work was done at one site and with one variety. Drying time will be longer in more humid places. The greenhouse plastic lasted two seasons and will need replacing, which is not counted in the cost.
# Conclusion
A solar dryer that a local workshop can build halves the drying time of mango slices and keeps more of their vitamin C and colour than open sun drying. Its cost is within reach of a group of smallholder farmers. Trials in more humid regions, and with other fruits, should follow.
# References
[1] A. Kitinoja and A. A. Kader, "Measuring postharvest losses of fresh fruits and vegetables in developing countries," Postharvest Education Foundation White Paper, 2015.
[2] S. K. Sharma and R. L. Sawhney, "Open sun and solar drying of fruits: a review of quality," Journal of Food Engineering, vol. 112, pp. 45-58, 2019.
[3] M. Okello, J. Patel and L. Nguyen, "Mixed-mode solar dryers for tropical fruits," Renewable Energy, vol. 148, pp. 210-221, 2020.
[4] AOAC International, Official Methods of Analysis, 21st ed. AOAC International, 2019.
[5] R. Fernandes and T. Ito, "Cost and performance of small solar dryers," in Proceedings of the International Conference on Applied Energy, 2021, pp. 88-95.The text is written in Markdown, a plain way of marking headings (#), lists (- and 1.), formulas ($...$), equations ($$...$$ on a line of their own), code (between lines of three backticks), tables (rows of |) and pictures. You can also save it as a file ending in .md and bring it in with the import button. See Import a paper you have already written.
Pasting a paper like this works in an empty paper. Where there is already text, it is pasted as plain text, so that nothing you wrote is replaced.
In your own paper, add each figure with the figure button, or paste or drop the picture into the text.
The order to write in
Section titled “The order to write in”Do not write from the first page to the last. This order is faster and gives a better paper:
- Figures and tables. They are your results. Decide what they show.
- Results. Describe each figure and table.
- Methods. You know what you did.
- Discussion.
- Introduction. Now you know what you are introducing.
- Conclusion.
- Abstract and title, last.
Introduction
Section titled “Introduction”Answer four questions, in order. One paragraph each is often enough.
- What is the problem? Start close to your subject, not with the history of the field.
- Why does it matter? To whom, and how much?
- What has been tried, and what is still missing? This is the gap your work fills.
- What do you do about it? State your contribution plainly. Many papers end the introduction with a short list of contributions.
A reader who stops after the introduction should know what you did and what you found.
Related work
Section titled “Related work”- Group by idea, not by paper. “Three approaches have been used…” reads better than a list of who did what.
- Say how each group relates to your work: what it achieved and what it left open.
- Be fair. Describe other work as its authors would.
- Cite the original source, and read what you cite.
Methods
Section titled “Methods”The test is simple: could another researcher repeat your work from this section alone?
Include:
- The setting: where, when, and on what or whom.
- The materials and equipment, with the model or version where it matters.
- The procedure, step by step, in the order you did it.
- What you measured, and how. Define every symbol in an equation.
- How you analysed it: the statistical tests and the software.
- Ethics: approval and consent, where people or animals are involved.
Write in the past tense. Say what you did, not what one should do.
Results
Section titled “Results”- Report, do not interpret. What it means comes in the Discussion.
- Lead with the main finding, then the supporting ones.
- Point to each figure and table in the text, and say what the reader should see in it: “Drying time fell by half (Figure 2).”
- Give numbers with their units and a measure of spread or uncertainty.
- Report what did not work too. A negative result is a result.
- Do not repeat a whole table in sentences. Pick out what matters.
See Figures and tables.
Discussion
Section titled “Discussion”- Start with the answer to the question the introduction asked.
- Explain it. Why do the results come out this way?
- Compare with earlier work. Where do you agree, where not, and why?
- Say what follows for practice, policy or later research.
Do not bring in new results here. Do not claim more than you showed.
Limitations
Section titled “Limitations”Say plainly what your work does not show: a small sample, one site, one season, an assumption that may not hold. Reviewers find limitations anyway. A paper that names its own is trusted more.
Conclusion
Section titled “Conclusion”One paragraph. Restate the contribution and its meaning, then point to what should be done next. Do not copy the abstract, and add nothing that was not in the paper.
Declarations
Section titled “Declarations”At the end of the preview you can give:
| Declaration | What to write |
|---|---|
| Author contributions | Who did what: designed the study, collected data, analysed, wrote. |
| Funding | Who paid for the work, with the grant number. Say “none” if none. |
| Conflicts of interest | Anything that could be seen to influence the work. Say “none” if none. |
| Data availability | Where the data and code can be found, or why they cannot be shared. |
| Acknowledgments | People who helped and are not authors. Ask them first. |
On a call that reviews without names, these are kept from the reviewers.
Who is an author?
Section titled “Who is an author?”An author made a real contribution to the work and can answer for it. Someone who only provided funding, a laboratory or general supervision is thanked in the acknowledgments. Agree the list and its order with everyone before you submit. Every author must have agreed to the submission.
References
Section titled “References”- Cite every source you used, and only those.
- Prefer recent work and work that has been peer-reviewed.
- Use the style the call asks for. Build the list in the References panel and the style is applied for you. See References and citations.
Honest writing
Section titled “Honest writing”- Use your own words. Copying sentences from another paper is plagiarism, even with a citation. Quote only where the exact words matter, in quotation marks.
- Do not send the same work to two places at once.
- Do not divide one study into several thin papers.
- If you used a writing or AI tool, check every sentence and every reference it produced, and follow the call’s rule on saying so. You answer for everything in the paper.
What reviewers mark down most
Section titled “What reviewers mark down most”| Problem | What to do |
|---|---|
| The contribution is not clear. | State it in the last paragraph of the introduction. |
| The methods cannot be repeated. | Add the missing details: sizes, settings, versions. |
| Claims without evidence. | Give the result that supports each claim, or remove the claim. |
| Figures that cannot be read. | Larger type, labelled axes, units. |
| The conclusion goes beyond the results. | Claim what you measured. |
| Poor language. | Short sentences. Ask a colleague to read it. |
| The references are old or few. | Search again. Cite the recent work. |
Next: Before you submit.
Quorum PressOpen callsRead researchSomething missing or wrong here? Tell us